¶ What is Omicron?
The Omicron algorithm is a software developed to analyze data from gravitational-wave detectors, particularly focusing on understanding and characterizing transient noise events, also known as glitches, in the data. It was designed in response to the need for a fast and efficient method to detect and analyze these transient events, which are crucial for confidently identifying true gravitational-wave signals.
-
Motivation and Significance: Omicron was developed following the first detection of gravitational waves by the LIGO and Virgo collaborations in 2016. It aims to detect and characterize transient noise events in data from gravitational-wave detectors, which can interfere with the detection of genuine astrophysical signals.
-
Software Description: Omicron is built upon the GWOLLUM package and relies on various external libraries for its functionalities. It implements the Q transform, a modification of the standard short Fourier transform, to analyze data time series for power excesses indicative of transient events.
-
Software Architecture: Omicron is designed with a modular approach, with different C++ objects created to achieve specific analysis tasks. These objects include modules for managing input data, performing signal conditioning, executing the Q transform, and saving detected events.
-
Software Functionalities: Omicron provides users with methods to conduct Q transform analysis on gravitational-wave data. It can be run from the command line and offers various output products, including spectrograms, time series plots, noise spectra, and reports.
¶ Omicron and Q
Omicron is designed to search for power excess in data time series using the Q transform (learn more about the Q transform equation here).
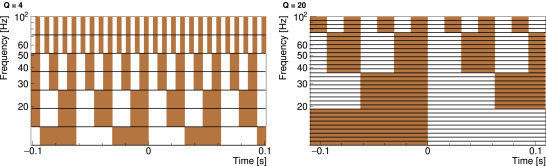
Above we have two Q planes, illustrating the multi-resolution analysis performed by Omicron. In virtue of the uncertainty principle, the time resolution increases (while the frequency resolution decreases) when the Q value decreases. The Q plane bins are filled with the tile signal-to-noise ratio estimated in order to produce characteristic spectrograms.
Finally, power excesses as measured by Omicron can be saved to disk. Tiles with a signal-to-noise ratio above a given threshold are collected and clustered over time. Resulting events are called triggers and are given parameters, e.g. time, frequency, Q and signal-to-noise ratio, given by the tile with the highest signal-to-noise ratio in the cluster. Tiles and triggers are operated by multiple GWOLLUM classes.